Healthcare organizations generate enormous volumes of claims data, but collecting data is not the same as gaining insight from it. The challenge for most revenue cycle teams is determining which metrics matter, how to interpret them consistently, and how to use them to improve reimbursement performance.
Healthcare claims analytics provides a structured way to measure claim quality, monitor denial patterns, evaluate reimbursement performance, and improve revenue cycle visibility. By analyzing claim submissions, claims adjudication outcomes, remittance data, and denial trends, healthcare organizations can identify operational issues before they become larger financial problems.
This article explains what healthcare claims analytics is, which metrics deserve ongoing attention, and how data-driven measurement supports stronger revenue cycle performance.
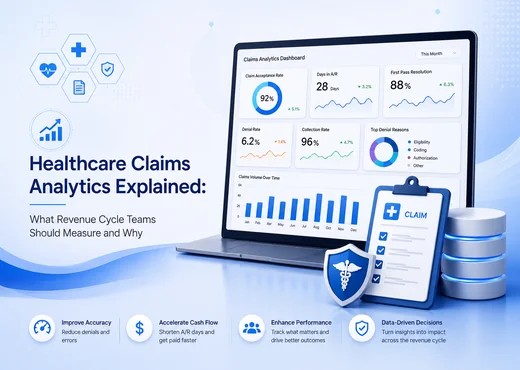
Healthcare Claims Analytics Explained: What Revenue Cycle Teams Should Measure and Why
What Is Healthcare Claims Analytics?
At its most basic level, claims analytics answers questions that billing and coding teams deal with every day:
- 01Which claims are being denied most frequently?
- 02Which payers are taking the longest to adjudicate?
- 03Are denial rates improving or worsening compared to last quarter?
- 04Where are clean claim rates falling below acceptable thresholds?
At a more strategic level, claims analytics provides the data foundation for revenue cycle leadership to make informed decisions about coding workflows, payer contract performance, billing process design, and staffing priorities. Without it, many revenue cycle decisions are based on anecdotal observation rather than systematic evidence.
What Is Claims Management in Healthcare?
Claims management in healthcare refers to the end-to-end administrative process of submitting, tracking, following up on, and reconciling medical claims with payers. It includes patient eligibility verification, prior authorization tracking, claim submission, remittance processing, denial management, appeal workflows, and payment reconciliation.
A healthcare claims management system is the operational infrastructure, including processes, workflows, and technology, that organizations use to manage this lifecycle across providers, payers, and service lines. Claims analytics transforms the data generated by these workflows into actionable information.
Organizations that manage claims effectively but do not analyze the results systematically miss opportunities to learn from recurring patterns. Likewise, organizations that analyze data without strong claims management processes often generate insights they cannot reliably act upon. Both capabilities work best together.
Why Revenue Cycle Visibility Matters in Healthcare Claims Analytics
Rising Denial Rates
Growing Reimbursement Complexity
Staffing Constraints
Evolving Payer Requirements
Healthcare Claims Analytics Metrics Every Revenue Cycle Team Should Track
- First-Pass Claim Acceptance Rate
The first-pass claim acceptance rate measures the percentage of submitted claims that are accepted and adjudicated without requiring rework or resubmission.
It is one of the clearest indicators of billing process quality. A declining first-pass acceptance rate often signals problems in coding, documentation, or claim submission workflows before claims reach the payer. - Denial Rate
The denial rate measures the percentage of submitted claims that are denied by payers during a defined period.
Tracking denial rates by payer, procedure category, and denial reason code helps distinguish systemic issues from isolated events. An overall denial rate may appear manageable until analysis reveals that most denials originate from a specific payer or service line. - Days in Accounts Receivable (AR)
Days in Accounts Receivable (AR) measures the average number of days between claim submission and payment receipt.
Higher AR days may indicate slow payer adjudication, ineffective follow-up workflows, or a large volume of claims requiring correction. Monitoring AR by payer and aging category helps revenue cycle teams prioritize collection efforts and improve cash flow performance. - Clean Claim Rate
The clean claim rate measures the percentage of claims submitted without errors, missing information, or documentation deficiencies.
Unlike first-pass acceptance rate, which measures payer outcomes, clean claim rate evaluates submission quality. A high clean claim rate supports reimbursement performance, but payers may still deny claims for reasons such as medical necessity or authorization requirements. - Reimbursement Variance
Reimbursement variance measures the difference between expected reimbursement based on contracted rates and actual payments received.
Consistent negative variance may indicate underpayment patterns that warrant additional review. This metric is particularly valuable for organizations managing multiple payer contracts with different reimbursement schedules. - Appeal Success Rate
The appeal success rate measures the percentage of denied claims that are successfully overturned through the appeals process.
A high success rate may indicate denial categories that deserve closer scrutiny. A low success rate often points to issues that should be corrected earlier in the claims submission workflow.
How Denial Trend Analysis Improves Revenue Cycle Performance
Denial trend analysis examines denial data over time to identify patterns that suggest systemic problems rather than isolated errors.
Consider a physician group experiencing a steady increase in denials for a specific CPT code across several billing cycles. Without trend analysis, the issue may not become visible until outstanding balances begin affecting AR performance.
With trend analysis, the pattern can be identified early and investigated promptly. The underlying cause may be a payer policy change, a coding workflow gap, or a documentation issue that can be addressed before it significantly affects reimbursement.
For specialty clinics managing prior authorization requirements across multiple commercial payers, denial trend analysis can reveal which payers generate the highest volume of authorization-related denials. This information supports staffing decisions and process improvements.
For hospitals managing large volumes of facility claims, denial trend analysis by revenue code and denial reason can help focus clinical documentation improvement efforts where they will have the greatest impact.
How Healthcare Claims Analytics Supports Revenue Cycle Decision-Making
Claims analytics improves decision-making by providing objective evidence instead of relying solely on experience or observation.
A revenue cycle director seeking additional coding resources can use analytics to demonstrate denial rates by coding category, quantify the financial impact of those denials, and evaluate the potential return on operational improvements.
A multi-specialty clinic reviewing payer reimbursement performance can use reimbursement variance data to identify recurring payment discrepancies.
An ACO preparing Shared Savings Program reporting can use claims analytics to monitor expenditure trends, utilization patterns, and financial performance indicators.
In each scenario, analytics supports the decision-making process. The final decision still rests with the people managing revenue cycle operations.
The Growing Role of AI in Healthcare Claims Analytics
AI-assisted capabilities are increasingly being used to address operational limitations associated with manual claims review.
One of the most practical applications is large-scale trend detection. Revenue cycle teams handling thousands of claims each month cannot realistically review every denial category, payer pattern, or coding variance manually. AI-assisted analysis can continuously monitor claims data and surface unusual trends that warrant attention.
Another use case is anomaly detection. If prior authorization denials suddenly increase for a particular procedure category, AI-assisted monitoring may identify the shift earlier than traditional reporting methods.
Workflow prioritization is also becoming more common. Analytics tools can help billing teams prioritize denied claims based on factors such as financial value, appeal potential, and reimbursement timelines.
These capabilities do not replace clinical judgment, coding expertise, or revenue cycle management experience. Their primary role is to provide decision support and improve visibility into claims operations.
How an Automated Medical Billing System Improves Data Visibility
An automated billing workflow improves data visibility by reducing manual data handling and reporting delays.
When eligibility verification, claim scrubbing, submission, remittance posting, and denial tracking occur within connected workflows, data becomes available for reporting much faster. Manual processes often create delays between operational events and reporting visibility.
Automation also improves consistency. When data is entered manually at multiple stages, reporting quality can suffer due to inconsistencies in data capture. Standardized workflows help create cleaner datasets and more reliable analytics.
For healthcare organizations, improved data quality and reporting consistency are often just as valuable as operational efficiency gains.
What Healthcare Organizations Should Look for in Claims Reporting and Analytics
- Denial Reporting by Reason Code and Payer
Meaningful denial analysis requires visibility into denial data by CARCs (Claim Adjustment Reason Codes) and payer, not just overall denial rates. - Trend Reporting Across Time Periods
Reporting should support comparisons across billing cycles, quarters, and custom date ranges to identify meaningful trends over time. - Reimbursement Variance Tracking
Organizations should be able to compare expected reimbursement against actual payments received by payer and service category. - AR Aging Visibility
Accounts receivable reporting should provide visibility by payer, aging category, and claim status to support collection prioritization. - Coding and Clean Claim Rate Reporting
Reporting should highlight clean claim performance by provider, payer, and coding category to identify improvement opportunities. - CCLF and Remittance Integration for ACOs
Organizations participating in value-based care programs benefit from analytics that combines CCLF data, 835 remittance files, and traditional claims reporting within a unified view.
Healthcare Claims Analytics Trends Shaping Revenue Cycle Operations in 2026
- Operational Benchmarking
Organizations are increasingly comparing key performance indicators against peer organizations with similar specialties, geographies, and payer mixes. Benchmarking provides valuable context for evaluating performance. - Payer Trend Analysis
Monitoring adjudication behavior over time helps identify changes in payer policies, medical necessity requirements, or reimbursement practices. - Reimbursement Forecasting
Analytics is expanding beyond historical reporting. Many organizations are using claims data, payer mix, and adjudication timelines to improve short-term reimbursement forecasting and cash flow planning. - Clinical Documentation Integration
Claims analytics is becoming more closely aligned with clinical documentation improvement initiatives. Many denial patterns originate from documentation issues rather than billing errors, making this connection increasingly important.
Conclusion
The metrics that matter most are those tied directly to financial performance, including first-pass acceptance rates, denial rates, days in accounts receivable, clean claim rates, reimbursement variance, and appeal success rates.
As payer complexity continues to increase, organizations with stronger analytical visibility into claims operations will be better positioned to identify issues early, improve reimbursement performance, and support informed decision-making.
For many healthcare organizations, the first step is evaluating whether current reporting can answer fundamental operational questions:
- 01Where are denials occurring?
- 02Are denial rates improving or worsening?
- 03Which payers contribute most to reimbursement delays?
- 04Where are reimbursements falling below expectations?
If existing reporting cannot answer those questions consistently, there may be opportunities to strengthen claims analytics capabilities and improve revenue cycle visibility.